Find a lake
Search by name or browse the available lakes by province and territory.
Leggett Labs / Consumer data application
A gauge reading gives you a number. LakeScout adds context: how the level compares with the usual range for the season, how it has changed recently, and which source supports the information.
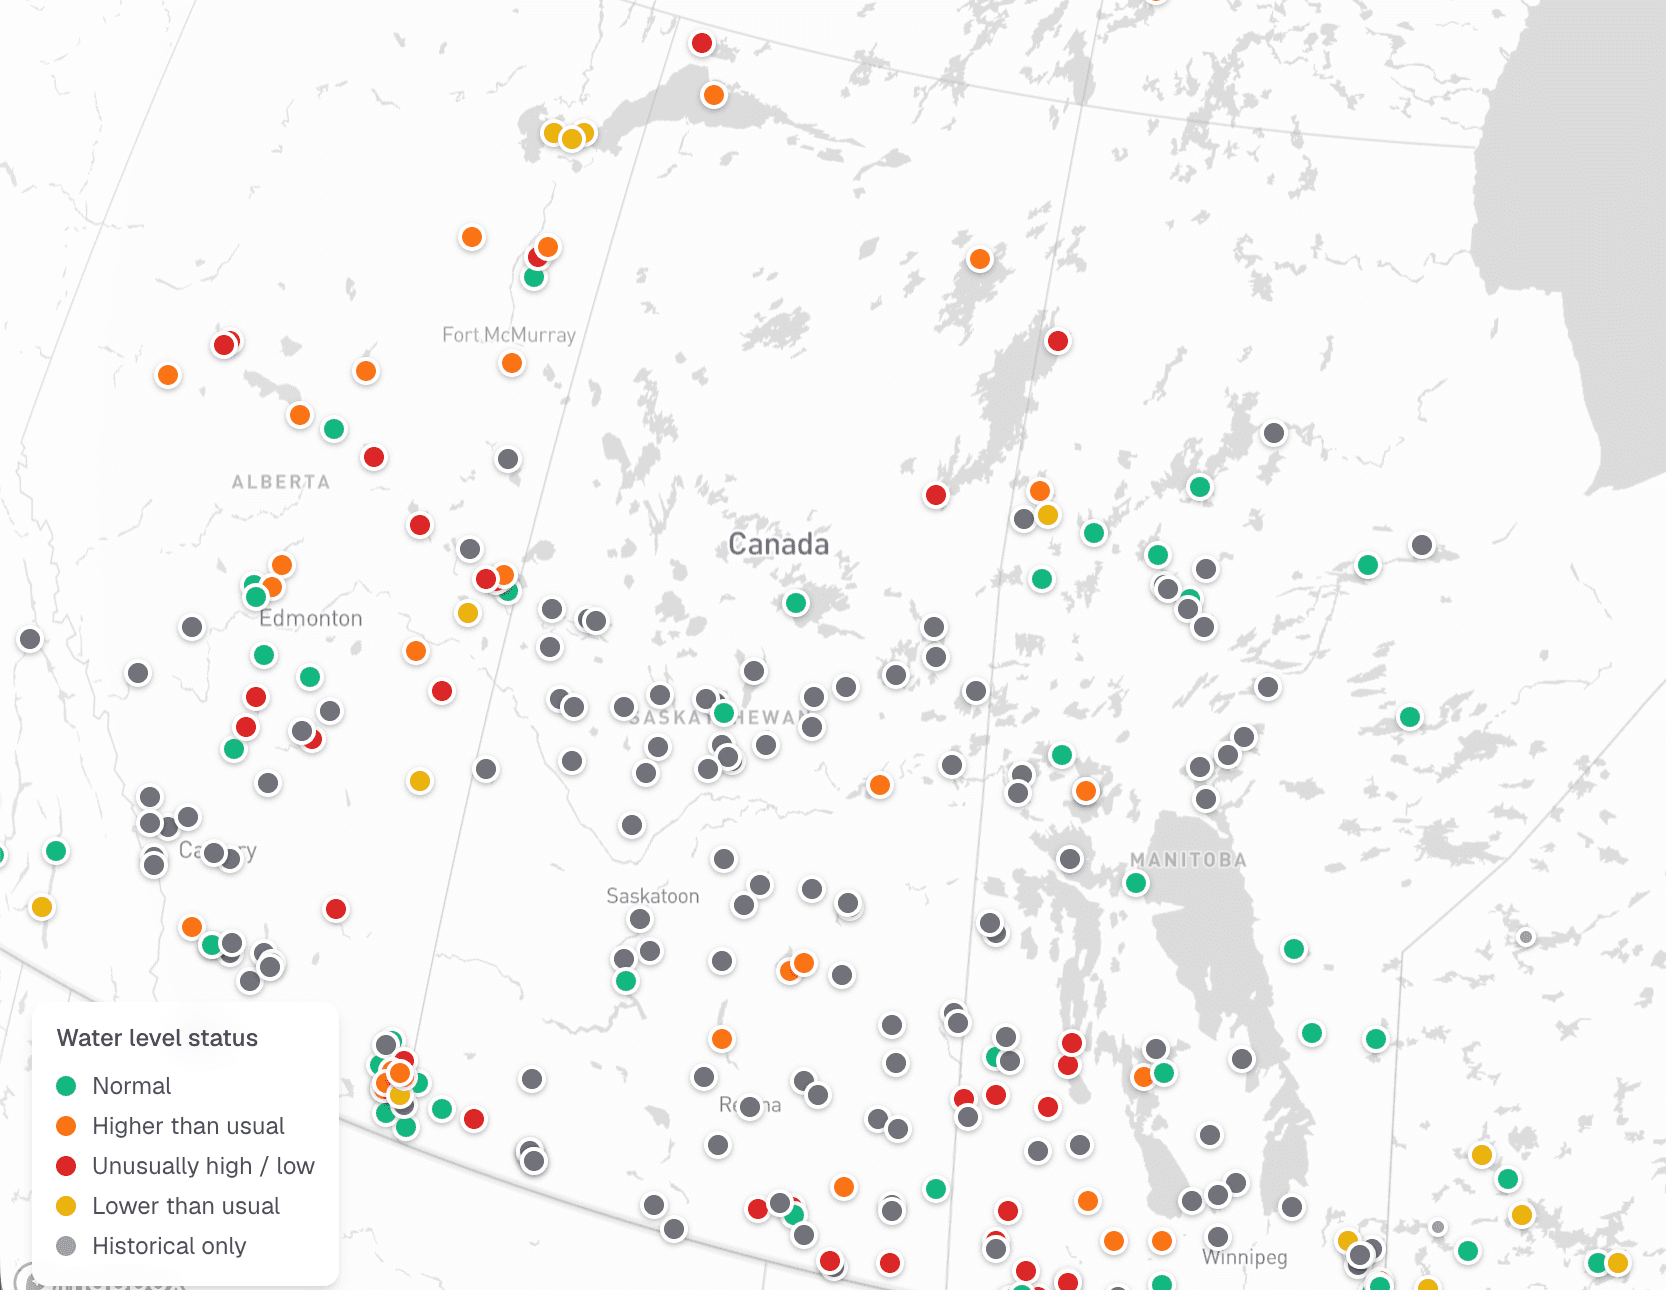
Screenshot supplied by Ben on September 22, 2026. A dated interface example, not live water levels or a forecast. Coverage and data availability vary by lake.
The need
A lake’s water level means more when you can compare it with the season and its recent history.
A raw reading alone does not tell you whether the level is typical for that lake at that time of year. LakeScout brings those comparisons into a readable lake-by-lake view.
The application
Search by name or browse the available lakes by province and territory.
Where sufficient data is available, see how the reported level compares with the lake’s usual seasonal range and review the seven-day direction and change.
Open technical details for the source station, observation and snapshot dates, historical coverage, and confidence information.
How it works
Start with a name search or browse the available regional listings.
Review the seasonal comparison and recent trend, where sufficient data is available.
Check the recorded dates, historical coverage, and source station behind the summary.
The Leggett Labs contribution
LakeScout brings lake discovery, seasonal comparisons, recent trends, and source information into one consumer-facing web application.
For Leggett Labs, it is an example of the work involved in making data useful: organizing it around a person’s question, explaining the result, and keeping the supporting detail available.